Verification
The International Energy Agency has sponsored a number of international research collaborations to further the state of wind energy technology and tools. One of these, Task 30: Offshore Code Comparison Collaboration (OC3), shared a spar design among many participants to compare performance as modeled by differed tool sets. A description of the OC3 spar is provided in [Jon10]. Since it is already a well-studied geometry, the OC3 spar design was selected as the focus of verification for FloatingSE. As part of the Task 30 effort, an ANSYS model of the OC3 spar, using shell elements combined with stiffeners and bulkheads, was also generated. This was taken as the truth standard for comparison.
Mass Properties
The first step in the verification exercise was to ensure that the mass properties of the spar predicted by FloatingSE matched those calculated by ANSYS. The comparison is shown in Table 5, where FloatingSE summary mass estimates are within \(1\%\) error of ANSYS. To ensure that these mass property calculations remain consistent over time despite changes in the underlying code, this OC3 mass properties comparison was installed within the FloatingSE test framework.
Property |
Units |
ANSYS |
WISDEM |
Error |
|---|---|---|---|---|
Bulkhead mass |
\(kg\) |
67,682 |
65,951 |
-2.6% |
Spar shell mass |
\(kg\) |
1,443,711 |
1,434,436 |
-0.6% |
Stiffener mass |
\(kg\) |
77,585 |
78,252 |
0.9% |
Total mass (no ballast) |
\(kg\) |
1,588,978 |
1,578,639 |
-0.7% |
Center of gravity |
\(m\) |
(0,0,-58.93) |
(0,0,-58.84) |
-0.1% |
Displaced volume |
\(m^3\) |
1,550 |
1,540 |
-0.7% |
Ixx moment of inertia (about CG) |
\(kg\cdot m^2\) |
2,178,400,000 |
2,186,163,760 |
0.4% |
Iyy moment of inertia (about CG) |
\(kg\cdot m^2\) |
2,178,400,000 |
2,186,163,760 |
0.4% |
Izz moment of inertia (about CG) |
\(kg\cdot m^2\) |
32,297,000 |
31,869,072 |
-1.3% |
Static Loading Stress
Without wind and waves
With the mass property comparison showing little difference between ANSYS and FloatingSE calculations, the verification proceeded to static cases. The spar was simulated in quiescent air and water (no wind, waves, or current), which isolated the weight of the turbine and hydrostatic pressure forces as the only sources on the substructure. The effective von Mises stress, as calculated by FloatingSE, was compared to the ANSYS model. This comparison, as a function of the z-coordinate along the spar axis (\(z=0\) at the waterline), is shown in Fig. 39. The FloatingSE stress calculation matches that of ANSYS nearly exactly over the top half of the spar, but deviates by approximately 5–10% towards the bottom half of the spar. In the bottom half of the spar, FloatingSE actually over-predicts the stress, a more conservative estimate, which is the preferable approach in a low-fidelity cost and sizing model.
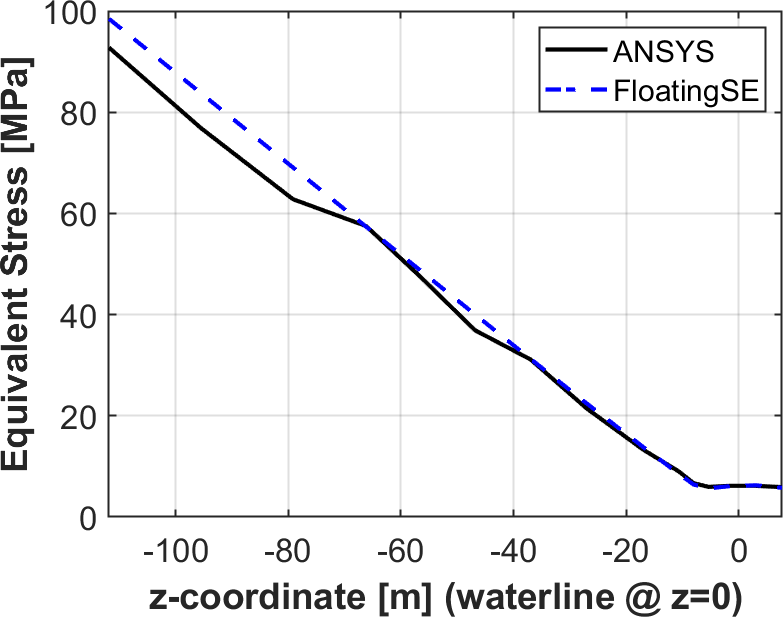
Fig. 39 Effective (von Mises) stress comparison between FloatingSE and WISDEM for a pure static loading case.
With wind and waves
At this time, more complicated loading cases, with wind and wave loading included, have not been performed.
Hydrodynamic Verification
The rigid body modes predicted by FloatingSE were compared against a FAST model of the OC3 spar. FAST was used as the truth solution in this case because it more accurately handles mooring dynamics than the ANSYS structural model and more accurately captures hydrodynamic phenomenon. The results are shown in Table 6. The errors in the surge, sway, roll, and pitch frequencies are 11-12%. FloatingSE actually estimates the heave mode frequency quite accurately, to less than 1% error, but is significantly off in estimating the yaw mode frequency. This was deemed acceptable as there is no focus on the yaw DOF in FloatingSE.
Eigenmode |
FAST |
WISDEM |
Error |
|---|---|---|---|
Platform surge [\(Hz\)] |
0.0080479 |
0.0071256 |
-11.46% |
Platform sway [\(Hz\)] |
0.0080475 |
0.0071256 |
-11.46% |
Platform heave [\(Hz\)] |
0.0324294 |
0.032235 |
-0.60% |
Platform roll [\(Hz\)] |
0.0342412 |
0.0385349 |
12.54% |
Platform pitch [\(Hz\)] |
0.0342602 |
0.0385349 |
12.48% |
Platform yaw [\(Hz\)] |
0.1210301 |
0.0526347 |
-56.51% |
Jason Jonkman. Definition of the floating system for phase IV of OC3. Technical Report NREL/TP-500-47535, National Renewable Energy Lab.(NREL), Golden, CO, May 2010. URL: https://www.nrel.gov/docs/fy10osti/47535.pdf.